May thaw of the Tatarstan economy: is bottom really below?
Economic results of the development of Tatarstan for 5 months in 2016 contain many positive signals
Economic results in May in Tatarstan, as well as the very month, were marvellously good: even process industry started to grow, while the budget is in surplus. Economic reviewer of Realnoe Vremya Albert Bikbov comments such positive advances with pleasure and hopes for the correction of few negative moments (especially concerning a weak growth of consumer market).
This May everything will flourish: both gardens and the economy
According to the economic results, May in Tatarstan became a logical continuance of the good start since the beginning of the year. Industrial Production Index of the Republic of Tatarstan grew by 2,9% within 5 months, compared to the same period last year, while this indicator in Russia, in general, increased just by 0,1%.
Industrial Production Index of the Republic of Tatarstan
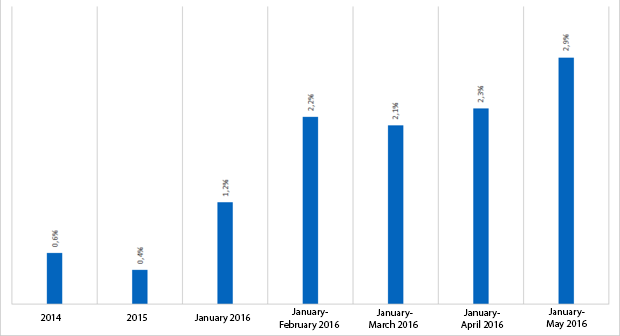
As you may see, the industrial production of the republic has been maintaining at quite a high positive level for four months and making positive changes. May was better than April, which, in turn, was better than March.
A positive flywheel is gathering speed!
Even low oil prices (taking into account their extremely low level in January 2016) did not manage to stop the growth of the industry: an average Urals crude oil price reduced by 35,7% from January to May and made up $36,01 per barrel. It should be noted that an average price of Urals was $56,05 per barrel in January-May 2016. This 1,5-fold reduction of the world oil prices was partially compensated by devaluation: an average nominal currency rate of the U.S. dollar for January-May 2016 grew by 23,1%, compared to the 2015 and was 71,1 rubles. The euro has almost the same growth (+23,9%).
This insufficient compensation affected the financial results of oil producers: the sum of the profit in the Republic of Tatarstan in Oil Extraction was just 42,7bn in January-May, while last year's total profit was 44,6bn rubles. As you may note, there is a lack of 4bn rubles of profit. Anyway our Oil Extraction is at a profit, in spite of these low prices!
But the state of affairs in the profits of other economic sectors is not so good.
If total profits of the enterprises of Tatarstan in January-April 2016 (120,0bn rubles) did not change, compared to the same period in 2015 (122,2bn rubles.), total losses, on the contrary, suddenly increased – 17,5bn rubles against 9,9bn rubles last year. Wholesale and retail trade (4,2bn rubles) and automotive industry and machinery (5,8bn rubles) became the main generators of the losses.
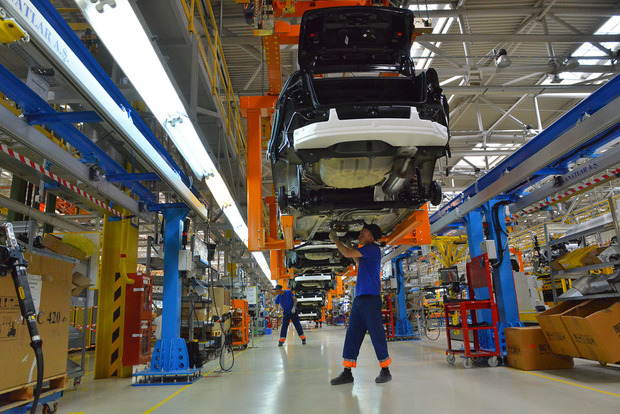
Stakhanov oil extraction is the recipe for success of the economy of the republic
We wrote many times that the reason for such a persistence of our economy is found in a great increase of oil extraction, and, consequently, export volumes. If the dollar oil prices fall, and devaluation doesn't compensate the decreases properly, how do exporters react in order to close the fall of the profit? The answer is simple: they try as much as possible to augment physical production volumes (extraction). Our oil workers did their best.
For instance, Tatneft Group of Companies extracted 11,6m tonnes within 5 months (+5,0% by 2015, +555,000 tonnes).
Mineral Extraction Index in Tatarstan
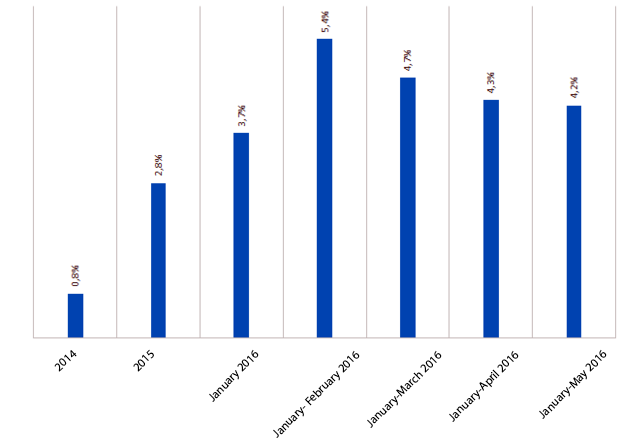
The growth of mineral extraction stabilised at a very high level. Looking at the data for the previous years, such a powerful extraction level can be characterised as 'unprecedented'. The Tatarstan oil extraction has not seen such Stakhanov rates in the recent 10 years.
Annual Growth Rates of Mineral Extraction in Tatarstan
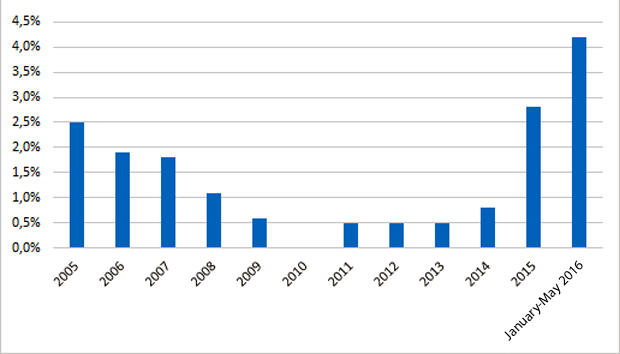
Due to the growth of the Mineral Extraction Index in January-April by 4,2% (+2,8% in Russia) and the sectors connected with oil extraction, the economy of our republic grows being resistant to external shocks.
Everything is excellent in the sectors linked with oil in technological conversion: oil refinery of Tatarstan grew by 1,5% (reduction by 4,8% in Russia) and chemical production in the region increased by 1,3%. Thanks to these 'three whales' (oil extraction, chemistry and oil refinery), we look much better than the whole country where Industrial Production Index is worse than in Tatarstan (+0,1%).
Forecasting the situation in this sector for the next months, I will be full of more optimism: there was a rising rally in the world oil market in April-June – the prices went up $50 per barrel, so that everything will be fine.
Brent Crude Oil Price Dynamics

Growth of process industry is the best signal
A great event took place in the process industry – Process Industry Index has crossed the positive zone for the first time in 15 long months (+1,2%). The event, undoubtedly, is great and quite a positive signal.
The state of affairs in the process industry is fine: sectors oriented to import substitution – textiles, food, wood processing, agriculture, production of rubber and plastic goods – grow.
Process Industry Index in Tatarstan

Production Indexes (January-April 2016 against January-April 2015)
Tatarstan | Russia | |
Process industry in general | 1,2% | -1,4% |
Production of food, including beverages and tobacco | 7,3% | 2,8% |
Textiles and clothing manufacture | 30,6% | 3,8% |
Production of leather, leather products and footwear | 51,6% | 9,0% |
Wood processing and manufacture of wood products | 22,3% | 0,0% |
Manufacture of rubber and plastic goods | 8,5% | 5,1% |
Machinery and equipment production | -7,1% | 1,2% |
Automotive industry and machinery | -1,6% | -1,5% |
A decrease in machinery and automotive industry is the only negative moment of Tatarstan… There is a topic to think over and work on…
Tatarstan | Russia | |
Production and distribution of electricity, gas and water | 9,8% | 0,1% |
House construction | 6,8% | -12,8% |
Agriculture | 2,1% | 2,7% |
Freight turnover of motor transport | 7,3% | -7,6% |
Retail turnover | -0,9% | -5,7% |
Growth and stabilisation of retail turnover at good levels is a good thing. This brightest indicator of consumer demand can cross the positive zone soon.
In May 2016, retail turnover increased by 4,1% in comparison with April 2016. Moreover, April 2016 reduced by 3,5% against March 2016. Growth again (as well as in March 2016) – maintenance at good levels during the previous 3 months is seen in general.
Monthly retail turnover, m rubles
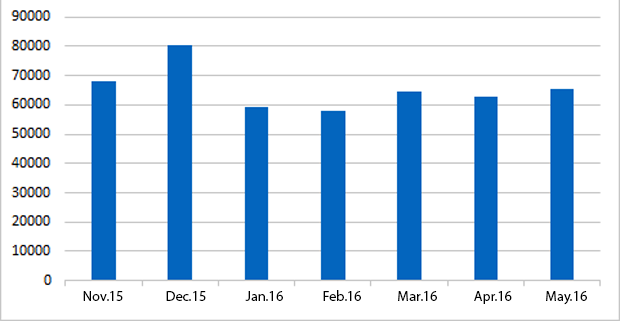
The growth of the difference is a good indicator. It is mainly explained by the stop of the fall of real monetary incomes and salaries, compared to 2015. Real monetary incomes in January-April 2016 in Tatarstan grew by 2,3% than in last year's analogous period. Real salary also increased a bit – by 2,8%. This stabilisation starts to push the population to start consuming, so that the problematic retail market will start to revive in the short run.
Tatarstan budget is resistant to shock
Incomes of the consolidated budget of Tatarstan in January-May 2016 were 100,6bn rubles, which is 2,9bn rubles or 3,0% more than in 2015.
Own incomes of the consolidated budget of Tatarstan (excluding inter-budgetary non-repayable receipts from Moscow) grew by 8,1bn rubles or 9,7%.
It all happened during an economic storm – extremely low prices in January 2016!
As you may observe, the budget of Tatarstan turned out to be relatively resistant to such a strong shock.
The main task of Tatarstan – income tax – increased by 4,3% and came to 31,2bn rubles in January-May 2016.
The growth of receipts of income tax is explained by the increase of the revenue by means of positive differences of the currency rate, price growth for goods, works and service in the domestic market and a gradual entering new markets by regional companies, including import substitution. Even an underpaid lump sum tax equal to 4bn rubles, compared to the 2015, did not worsen the positive tendency.
Income tax in January-May 2016 increased by 12,0% (+2,6bn rubles) in comparison with the previous year and made up 24,1bn rubles, which is explained by the rise of salary and dividend payment of several large organisations of the republic. What is more, the rise in the number of workers in facilities under construction within the scope of the fulfilment of investment projects and additional payments as a result of control events favoured the growth of income tax.
The volume of inter-budgetary non-repayable receipts from the Russian Federation reduced by 5,3bn rubles than in 2015. A possible reason is that there was an urgent financing of events on preparation and organisation of the 16th FINA World Championships in Kazan in 2015. 3bn rubles were expended from the budget of the Russian Federation (Resolution as from 18 March 2015 No.248). So, after the departure of the 'sports component' in 2015, the 'brook' of federal subsidies significantly became smaller.

Costs: money is needed – start to borrow
The expenditures of the budget in January-May 2016 turned out to be more than in 2014 by 8,3bn rubles or 9,0%.
Even there was a surplus. So, incomes exceeded costs. But this surplus is small and almost unnoticeable. According to the results for 5 months, the budget surplus made up 0,5bn rubles. It is little, of course, if we compare it with the same period in 2015 when budget surplus was 5,9bn rubles. But don't forget how extremely difficult January 2016 was for the economy! Moreover, there is a huge deficit in the execution of the consolidated budget in Russia in general (1,5tr rubles or 10% of the incomes). So, now our state is just excellent!
Budget surplus cancelled budgetary borrowings – the level of the state debts has changed just a bit since the beginning of 2016. According to the book debt of the Republic of Tatarstan, the volume of the internal debt as from 1 June 2016 was 91,9bn rubles (where 82,1bn rubles are budgetary loans from Moscow, and 9,8bn rubles are guarantees in foreign currency for KAMAZ PJSC). Attention should be paid to the following detail – the debt on budgetary loans from Moscow increased by 0,8bn rubles in April 2016 (for the first time since June 2015). It is not too much, but it will be necessary to augment debts in order to pay off the following costs:
- It should not be forgotten, of course, that the expected budgetary deficit in 2016 is quite big – 9,3bn rubles.
- Return of the budgetary loans that were granted earlier. In 2016, 2,2bn rubles are to be paid off.
As you may notice, it is necessary to augment the incomes of the budget (it is unlikely) or augment budgetary debts by a maximum of 6bn rubles and pay off other debts using the rest of the budgetary money.
The increase of the debts on budgetary loans cannot be considered as a negative factor because they are taken out for 3 years at 0,1% per year. It is a gift in the current inflation. So, there is logic and sense in the actions of the Ministry of Finance of Tatarstan.

There is another way – to reduce costs. But!
It is very difficult to reduce the costs – urgent and socially important costs impede it because they need a complete financing. In the planned budget for 2016, they accounted for 74,7% of the total volume of the costs. This is why in the first quarter there was a regime of urgent and socially important costs. Health, social policy and education are the urgent and socially important costs. They were financed better than last year.
As for the costs that are not urgent like National Economy, the financing is at last year's level.
Consolidated budget of Tatarstan in January-May 2016 and 2015 (bn rubles) de facto
Articles | 5 months2016 | 5 months2015 | Absolute change | Relative change |
1. Income of the budget | 100,6 | 97,7 | +2,9 | +3,0% |
1.1. Own funds of the budget | 91,4 | 83,3 | +8,1 | +9,7% |
1.1.1. Corporate tax | 31,2 | 29,9 | +1,3 | +4,3% |
1.1.2. Income tax | 24,1 | 21,5 | +2,6 | +12,0% |
1.1.3. Wealth tax | 14,7 | 14,0 | +0,7 | +5,0% |
1.1.4. Excises | 11,9 | 8,3 | +3,6 | +43,3% |
1.1.5. Lump sum tax | 4,1 | 3,9 | +0,2 | +5,1% |
1.1.6. State property income | 1,5 | 1,3 | +0,2 | +15,4% |
1.1.7. Fines, sanctions | 1,5 | 1,5 | 0 | 0,0% |
1.2. Non-repayable receipts | 9,1 | 14,4 | -5,3 | -36,8% |
2. Expenditure budget | 100,1 | 91,8 | +8,3 | +9,0% |
2.1. Education | 32,9 | 26,8 | +6,1 | +22,8% |
2.2. National economy | 26,1 | 26,3 | -0,2 | -0,7% |
2.3. Health | 12,5 | 11,4 | +1,1 | +9,6% |
2.4. Social policy | 11,6 | 11,0 | +0,6 | +5,4% |
2.5. Housing and Communal Services | 5,7 | 5,1 | +0,6 | +11,8% |
3. Budget suprlus | 0,5 | 5,9 | -5,4 |